

Exploring Different Types of Chart Patterns in Stock Market Analysis
Welcome to our comprehensive guide on different types of chart patterns in stock market! Charts play a crucial role in technical analysis, and understanding various patterns can give you valuable insights into market trends and potential trading opportunities.
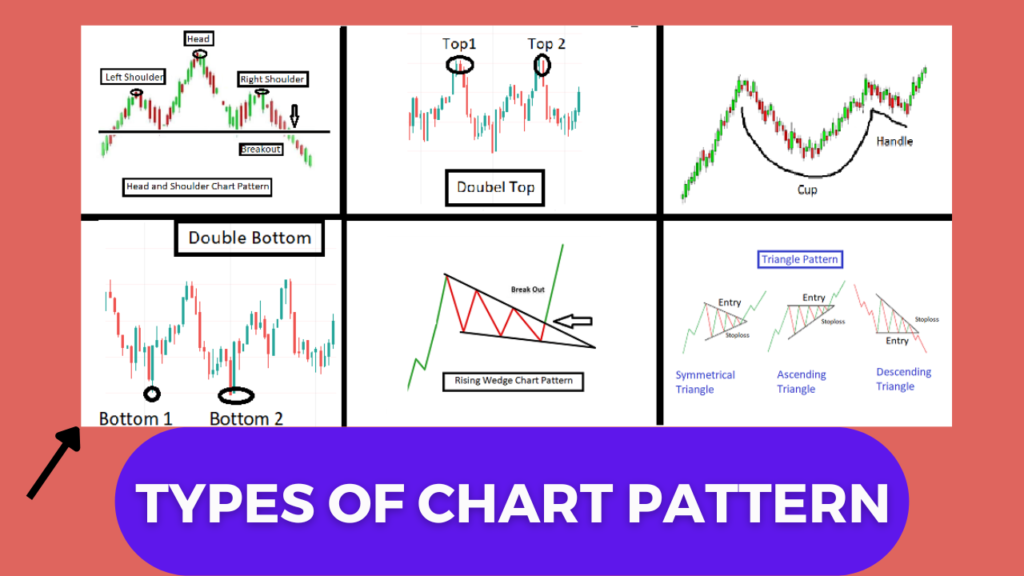
In this article, we will explore a wide range of types of stock chart patterns, from classic patterns like head and shoulders, double tops, and triangles, to more complex formations like cup and handle, wedges, and flags
| Register Now ! and Get Free Stock Market Courses |
What is chart pattern ?
Observing price actions during stock trading periods through chart patterns is an effective method. This is because chart patterns have the tendency to repeat themselves, which appeals to human psychology, particularly that of traders.
Chart patterns are formed by the price movements of a stock over a certain period of time, and can indicate potential buying or selling opportunities based on historical price behavior. Acquiring the skill to identify these patterns at an early stage can provide a significant edge in the markets.
Stocks chart patterns, along with technical indicators like volume, support and resistance levels, RSI, and Fibonacci retracements, can assist in recognizing trend continuations and reversals.
Types of stock market chart patterns :
Some examples of types of stock market chart patterns are explained below
1. Flag Pattern


The flag pattern is a common technical analysis chart pattern that appears as a small rectangle or parallelogram, also called a “flag,” that is attached to a flagpole-like structure. The flagpole is the initial strong price move in a particular direction, followed by a period of consolidation represented by the formation of the flag.
2. Wedge

Wedges are patterns that can indicate both bullish and bearish reversals, as well as continuations. They form by connecting two converging trend lines, either in a rising or falling manner. A rising wedge pattern emerges when the stock price increases over time, while a falling wedge pattern appears when the stock price decreases over time.
To draw a wedge pattern, one can connect the peaks and troughs using trend lines. Following a price breakout from a wedge pattern, there is usually a sharp price movement in one direction or the other.
3. Triangle pattern
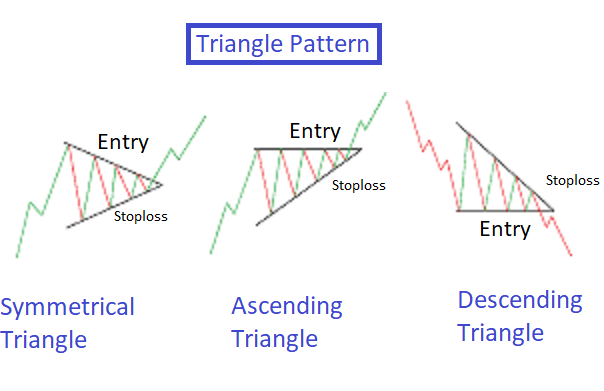
The ascending triangle is a bullish continuation pattern that indicates a trend with specific entry points, profit targets, and stop-loss levels. The pattern is formed when the resistance line intersects the breakout line, pointing out the entry point.
On the other hand, a descending triangle is the opposite of the ascending triangle, indicating a decrease in demand, and a breakdown is likely to occur with a descending upper trend line.
4. Cup and Handle Pattern
The Cup and Handle pattern is a bullish chart pattern that is formed when the price of an asset forms a “U” shape, resembling a cup, followed by a small downward movement known as the “handle.” The pattern is considered to be a continuation pattern, indicating that the asset’s upward trend is likely to continue after the handle is formed.
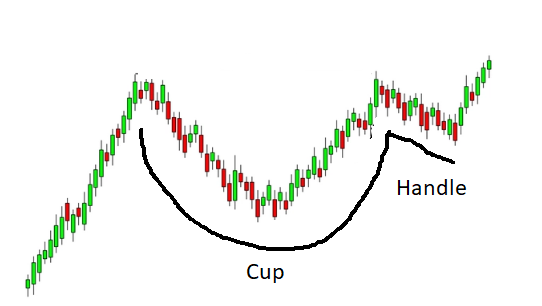
The cup portion of the pattern is formed by a gradual increase in the price of the asset, followed by a sharp decline, and then a gradual recovery back to the previous high. Usually, the handle of the cup is shaped by a slight downward movement of around 10-15% of the cup’s depth, which is then followed by an upward breakout.
5. Head and shoulders pattern
The head and shoulders pattern is a type of reversal pattern that can manifest either at market bottoms or tops, comprising three consecutive pushes. The pattern commences with an initial peak or trough, followed by a second one that is usually more substantial, and finally, a third push that mirrors the first one.
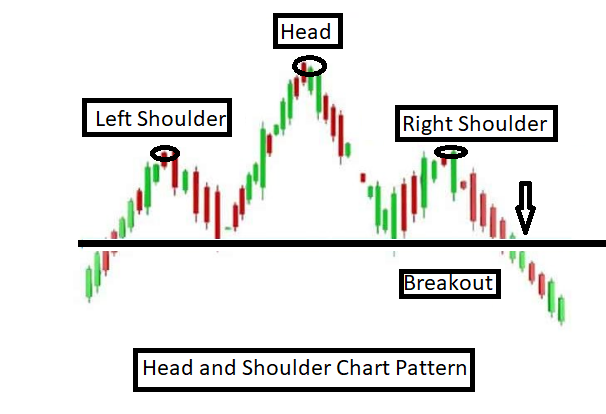
Trendlines that connect the peaks and troughs between the head and shoulders can be drawn horizontally or with a slight slope. During the development of this pattern, the volume may decrease, but it can bounce back when the price breaks either above (for a head and shoulders bottom) or below (for a head and shoulders top) the trendline.
6. Double Top and Bottom pattern
The Double Top and Bottom patterns are commonly used in technical analysis to identify potential trend reversals in financial markets. A Double Top pattern is formed when an asset’s price rises to a certain level, then falls back, rises again to the same level, and then falls back again.

This creates a pattern that looks like two peaks, or a “M” shape. It’s considered a bearish pattern and signals that the asset’s price may soon begin to decline.
On the other hand, a Double Bottom pattern is formed when an asset’s price falls to a certain level, bounces back up, falls back to the same level, and then bounces back up again. This creates a pattern that looks like two valleys, or a “W” shape. It’s considered a bullish pattern and signals that the asset’s price may soon begin to rise.
7. Gaps
A gap is a chart pattern that occurs when there is a significant difference between the closing price of an asset and its opening price on the following day. A gap occurs when there is no trading activity between the closing price of one day and the opening price of the next day.
There are three types of gaps:
1. Common Gap:
This is the most common type of gap and occurs frequently in financial markets. It is usually caused by a change in market sentiment or news that affects the asset’s price.
2. Breakaway Gap:
This type of gap occurs when an asset’s price breaks out of a trading range or a significant support or resistance level. It is also known as strong bullish or bearish signal.
3.Exhaustion Gap:
This type of gap occurs when an asset’s price has been in a strong uptrend or downtrend for an extended period, and there is a sudden gap in price. It is a signal that the trend may be coming to an end and that a reversal may be imminent.
4. Runaway gaps:
A runaway gap is a type of gap in chart patterns that occurs during a trend and is characterized by a gap that occurs after a significant move in price. The gap indicates a sudden and significant increase in demand or supply, causing prices to “run away” from their previous levels.
Runaway gaps typically occur in the middle of an existing trend and suggest that the trend will continue. Traders use runaway gaps as a signal to enter or exit positions, depending on the direction of the gap. If the gap is bullish, traders may consider buying the stock or asset, expecting prices to continue their upward trend.

| Register Now ! and Get Free Stock Market Courses |
Also Read More :
- Best Discount Broker in India
- Best Penny Stocks Below 5 rs.
- Best Stock Market Investment for Beginners
Conclusion:
In conclusion, stock chart patterns serve as valuable tools for traders and investors to analyze and interpret market trends. By studying these patterns, individuals can gain insights into the psychology of market participants and make more informed decisions regarding buying, selling, or holding stocks.
There are various types of stock chart patterns, each with its own characteristics and implications. Trend patterns, such as uptrends and downtrends, indicate the overall direction of a stock’s price movement. Reversal patterns, like head and shoulders or double tops/bottoms, suggest a potential change in the prevailing trend.
Continuation patterns, such as flags, pennants, and triangles, indicate a temporary pause before the price resumes its previous trend.
Understanding these patterns can help traders identify potential entry and exit points, manage risk, and improve the timing of their trades. Ultimately, successful interpretation of stock chart patterns requires experience, skill, and a comprehensive understanding of market dynamics.
By consistently honing their technical analysis skills, market participants can enhance their ability to navigate the complexities of the stock market and potentially improve their investment outcomes

FAQs
Que 1. What is a chart pattern in the stock market?
Ans. A chart pattern is a recognizable formation on a stock price chart that can help investors identify potential trend reversals or continuations.
Que 2. What are the different types of chart patterns in the stock market?
Ans. There are several types of chart patterns, including:
- Head and Shoulders
- Double Top and Double Bottom
- Triple Top and Triple Bottom
- Ascending and Descending Triangles
- Rectangles
- Flags and Pennants
- Wedges
Que 3. How do chart patterns work in the stock market?
Ans. Chart patterns are formed by the price movements of a stock over a certain period of time. When a chart pattern is recognized, traders and investors can use it to make informed decisions about buying or selling a stock. Chart patterns can indicate potential trend reversals or continuations, as well as price targets.
Que 4. How reliable are chart patterns in the stock market?
Ans. The reliability of chart patterns varies depending on the pattern and the market conditions. Some chart patterns are more reliable than others, and it’s important to consider other factors such as volume, price action, and market news before making any trading decisions based on chart patterns.
Que 5. Can chart patterns be used for any type of stock or market?
Ans. Chart patterns can be used for any type of stock or market, as long as there is sufficient historical price data available to analyze. However, it’s important to remember that chart patterns are just one tool in a trader’s toolbox, and should be used in conjunction with other analysis techniques